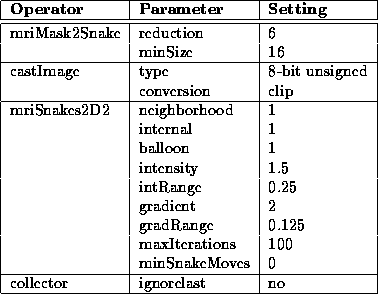
Table 8.7: Generate Final Brain Mask igraph operator parameters.
The final masks produced by the Generate Final Brain Mask process for each of the 5 MRI data sets are presented and discussed in this section. Every mask was produced using identical parameter settings in the Generate Final Brain Mask igraph. These setting are listed in Table 8.7.

Table 8.7: Generate Final
Brain Mask igraph operator parameters.
The intracranial boundary defined by the final brain mask of Data Set 1 is overlaid on the PD-weighted MR volume in Figure 8.17. The mask outlines the brain remarkably well in all slices. Figure 8.18 shows slice 13 at a higher resolution. Notice that the final mask covers the entire brain, whereas the initial mask lies inside the brain.
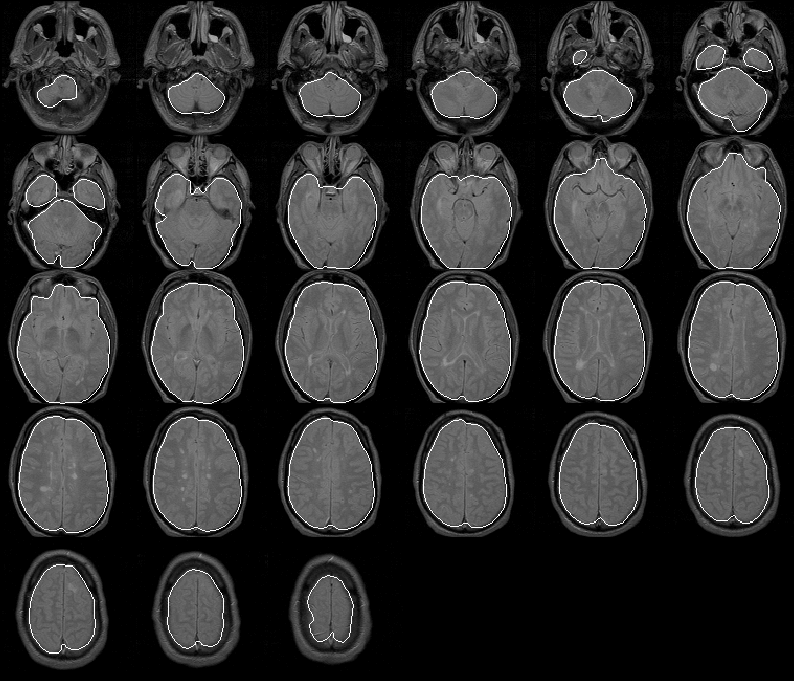
Figure 8.17: The final brain mask for
MRI Data Set 1 overlaid on the PD-weighted scan.
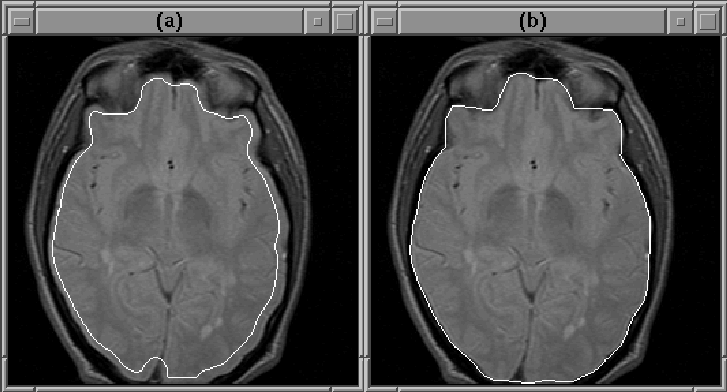
Figure 8.18: A closeup of slice 13 of
MRI Data Set 1. The Generate Final Brain Mask process enlarges
the initial brain mask, (a), to cover the entire brain, (b).
Only slight errors occur in the first slice and some slices containing the eyes. In these slices, the brain mask excludes some very low intensity brain tissue. The errors are understandable since these low intensity tissues appear very similare to the intracranial cavity tissues.
Figure 8.19 shows the intracranial boundary drawn manually by Brian Johnston for this data set [21][23][22][24]. Figure 8.20 compares Johnston's boundary with the automatically generated boundary of slice 13. Johnston's manual drawn boundary consistently falls inside the brain. Otherwise, the two intracranial boundary estimates are extremely close.
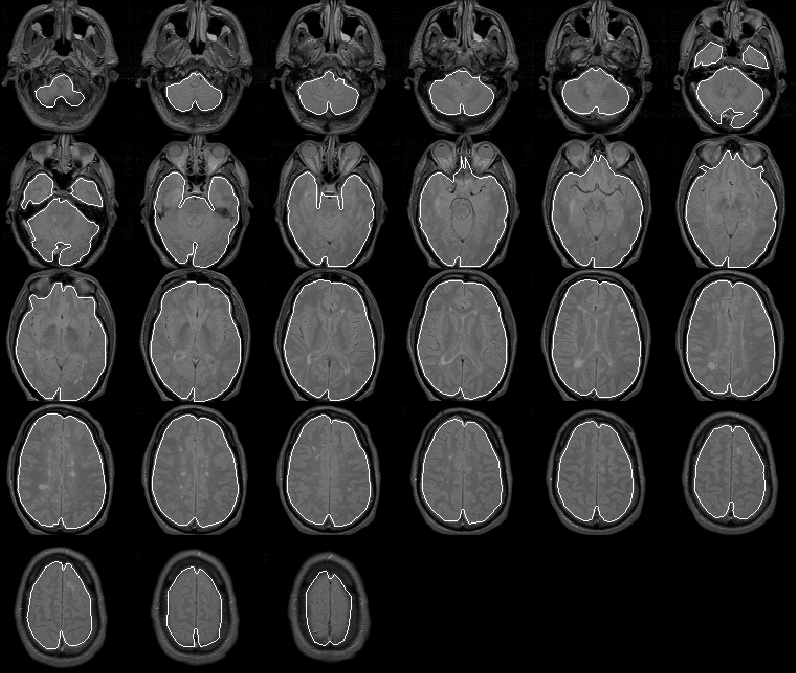
Figure 8.19: A manually drawn
intracranial boundary for MRI Data Set 1 overlaid on the PD-weighted
scan.
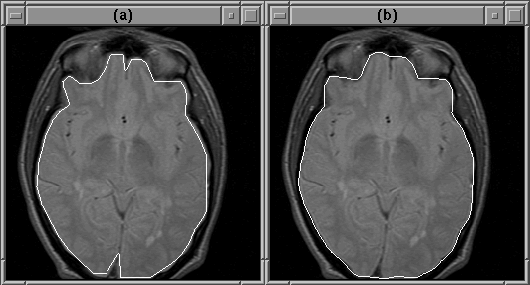
Figure 8.20: A manually drawn
intracranial boundary for slice 13 of MRI Data Set 1, (a), compared to
the automatically detected boundary, (b).
Unfortunately, an intracranial boundary drawn by an expert, such as a radiologist, is presently unavailable for Data Set 1. Therefore, an expert evaluation of the final brain mask for Data Set 1 is left for future work.
Figure 8.21 shows the final brain mask for Data Set 2 overlaid on the PD-weighted MR scan. Again the intracranial boundary is detected exceptionally well in all slices. The final brain mask contains no remarkable errors.
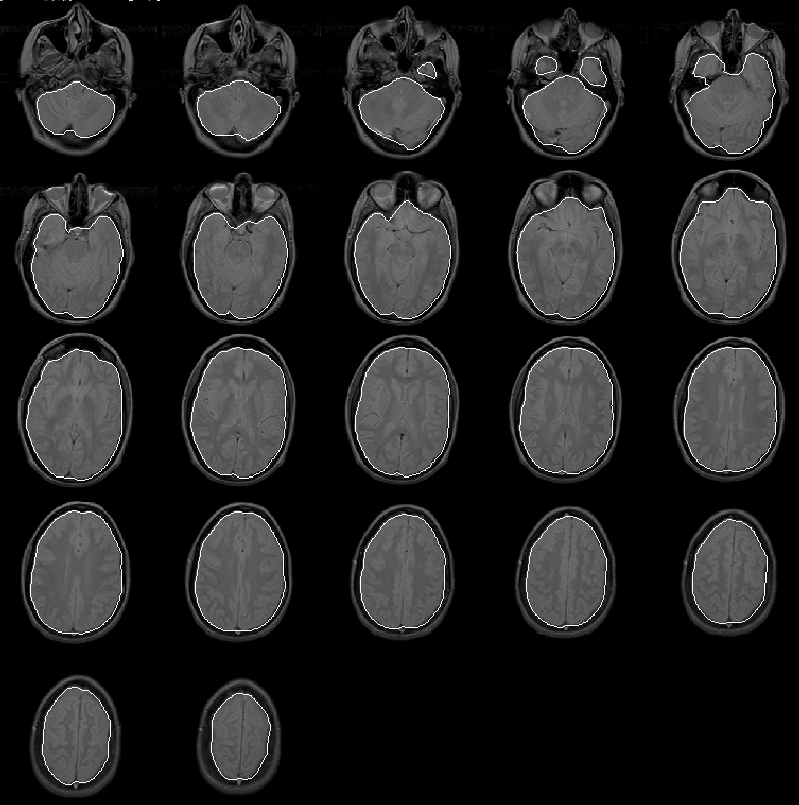
Figure 8.21: The final brain mask for
MRI Data Set 2 overlaid on the PD-weighted scan.
Figure 8.22 shows the regions in slice 11 that a radiologist identified as brain tissue. At least for slice 11, the automatically detected intracranial boundary appears to outline the brain accurately.
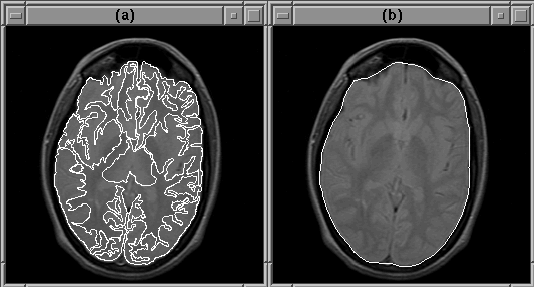
Figure 8.22: (a) Brain
tissues in slice 11 of MRI Data Set 2 identified by a radiologist. (b)
The automatically detected intracranial boundary.
A quantitative analysis of the intracranial contour for just this slice would be statistically insignificant in terms of the whole MR volume. Expert validation of the contours produced for the entire volume is necessarily delayed for future work.
As illustrated by Figure 8.23, the Generate Final Brain Mask process produces results for Data Set 3 that are comparable to the results for the previous data sets. Slight errors occur in the lower slices, where the mask excludes low intensity brain tissues. Another small error occurs in slice 9 where the mask includes a tiny region for bright tissue outside the brain.
We have yet to acquire expert information regarding the intracranial boundary for Data Set 3. Expert validation of the final brain mask is again left for future work.
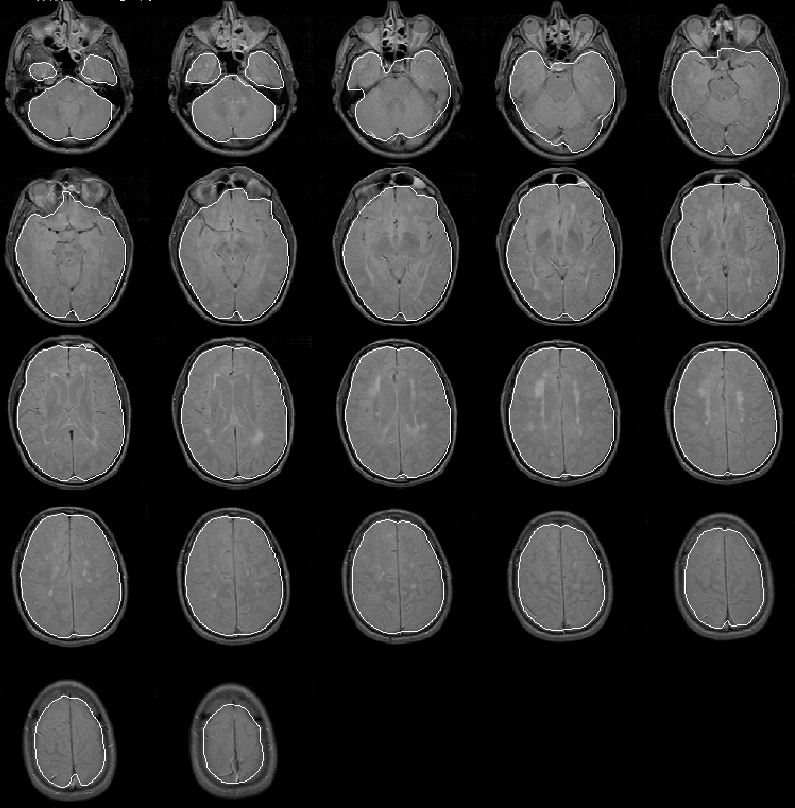
Figure 8.23: The final brain mask for
MRI Data Set 3 overlaid on the PD-weighted scan.
The final brain mask for Data Set 4 is shown in Figure 8.24. Again, the mask appears to be very accurate. Very small errors occur in slices 11 through 14 where the Generate Final Brain Mask process mistakes bright regions near the forehead as brain. Expert evaluation of the mask is left for future work.
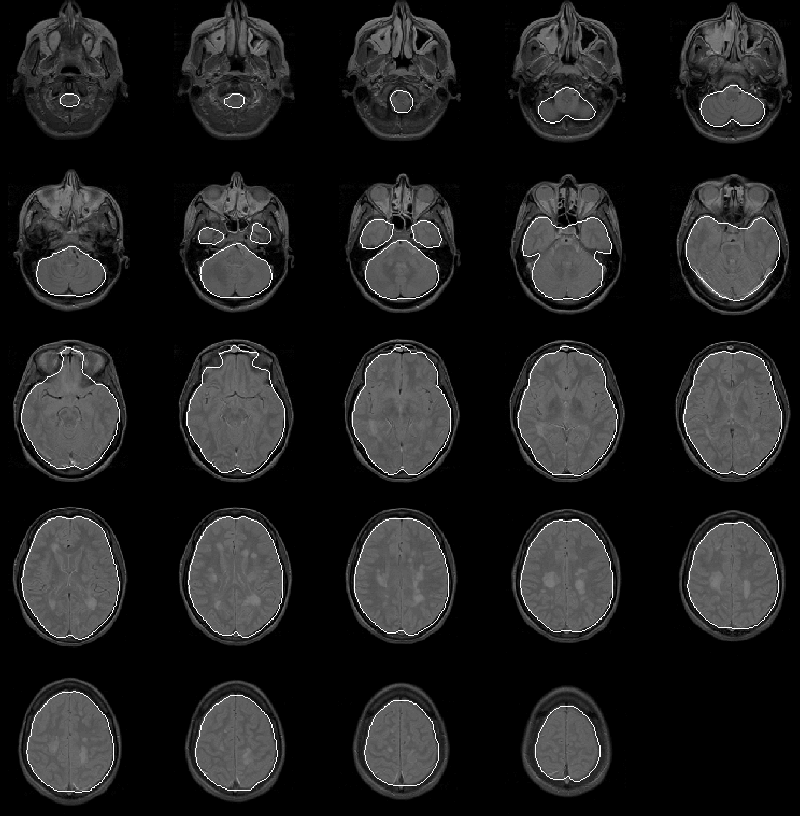
Figure 8.24: The final brain mask for
MRI Data Set 4 overlaid on the PD-weighted scan.
As with the final brain masks of the previous 4 data sets, the final brain mask produced for Data Set 5, shown in Figure 8.25 contains few remarkable errors. The mask misclassifies some small regions of extremely low intensity brain tissue, but is otherwise accurate. The mask will be quantitatively evaluated when expert information becomes available.
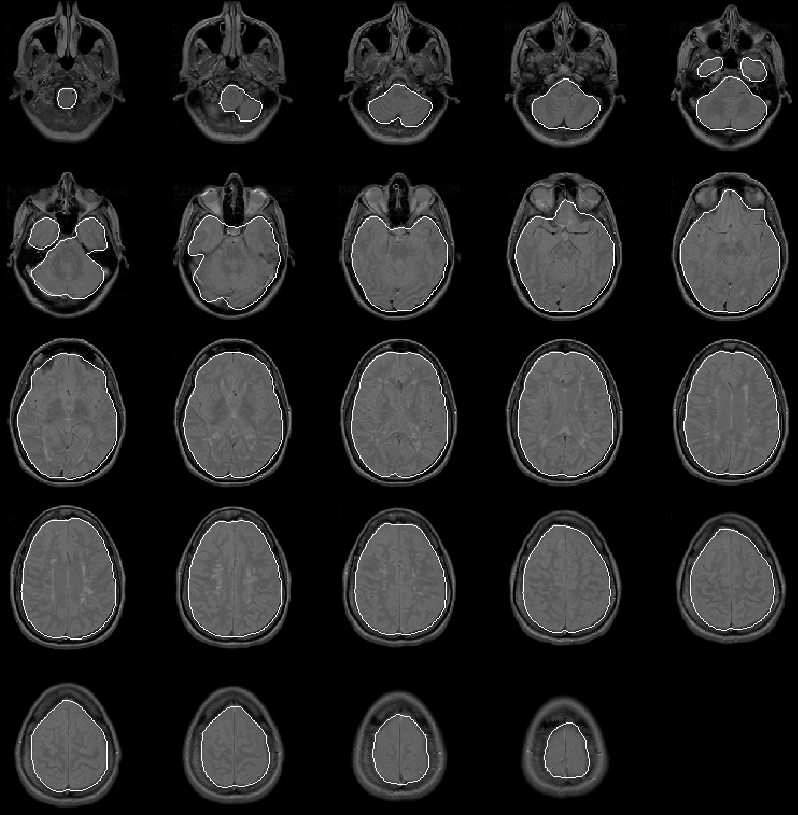
Figure 8.25: The final brain mask for
MRI Data Set 5 overlaid on the PD-weighted scan.
Table 8.8 lists approximate benchmarks for the Generate Final Brain Mask igraph. A benchmark for each data set is given.
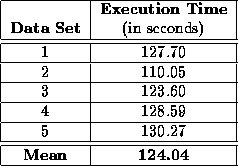
Table 8.8: Approximate
benchmarks for the Generate Final Brain Mask igraph running an
a SUN SPARC 5 workstation.
The Generate Final Brain Mask process produces apparently accurate final brain masks for the 5 data sets presented herein in an average of 2.07 minutes on a Sun SPARC 5 workstation. The accuracy of the masks will be quantified if and when expert information from radiologist becomes available.
The Correct Intensity process uses the masks produced by the Generate Final Brain Mask process to reduce intensity variation due to RF inhomogeneity in the MRI data sets (see Chapter 7). The following section contains the results of the Generate Intensity process. To a small degree, the goodness of the these results verifies the correctness of the final brain masks.