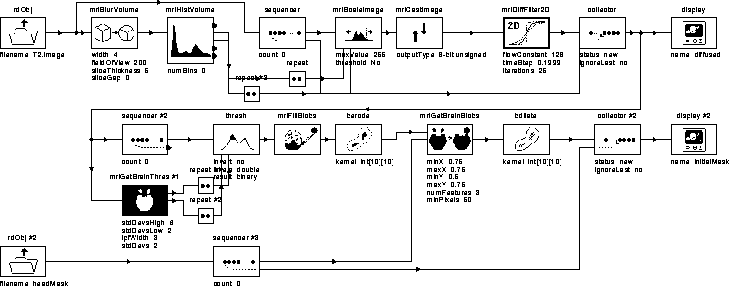
Figure 7.6: WiT igraph implementing the Generate Initial Brain Mask process.
To isolate the brain from the other head components, such as the eyes, skin, and fat, we need to highlight the brain tissue and then use a threshold to remove unwanted components. The Generate Initial Brain Mask process uses a nonlinear anisotropic diffusion filter to reduce the voxel intensities of tissues outside the brain. It then automatically thresholds the diffused volume and uses spatial information provided by the head mask to produce a mask of the brain. T2-weighted MR images are used since they exhibit good contrast between brain and non-brain tissues.
The igraph for the process is given in Figure 7.6. A brief description of each operator in the igraph is listed in Table 7.2. A detailed description of the igraph is presented in the following sections.

Figure 7.6: WiT igraph implementing
the Generate Initial Brain Mask process.
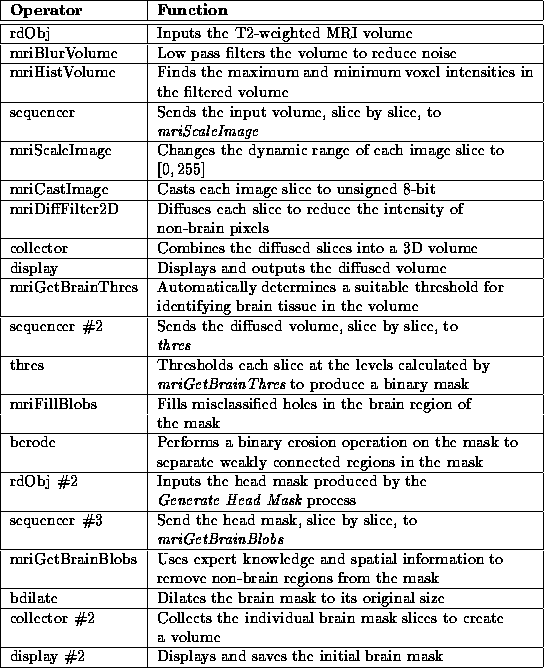
Table 7.2: A brief
description of the operators used in the Generate Initial Brain
Mask igraph.
The T2-weighted MR image volume input by rdObj is normalized to the range [0,255] before being diffused so that the diffusion filter parameters can remain fixed for all data sets. The normalization is produced by the sequence of operators between rdObj and mriDiffFilter2D.
mriBlurVolume low pass filters the input volume to reduce the intensity of image speckle. mriHistVolume outputs the maximum and minimum voxel intensities in the filtered volume. These values should correspond to data voxels since the speckle noise has been attenuated.
mriScaleImage adjusts the dynamic range of the original volume
to  :
:

where  and
and  are the original and scaled pixels
respectively, and
  and
and  are the minimum and
maximum voxel intensities produced by mriHistVolume.
mriCastImage casts the floating point images output by mriScaleImage to 8-bit unsigned images by rounding each pixel value to the nearest integer. The 8-bit unsigned values allow the diffusion filter to be optimized using a lookup table.
mriDiffFilter2D diffuses each slice of the normalized image volume. The parameters of mriDiffFilter2D were chosen such that pixel intensities in regions corresponding to brain tissue would be regularized while pixel intensities in other regions would be attenuated. See Chapter 4 for an explanation of these parameters. The attenuation of non-brain voxels enables a single threshold to isolate the brain, even in the presence of RF inhomogeneity.
The diffused slices are collected into a single volume by collector, then displayed and output by display. Figure 7.7 shows that a single binary threshold could segment brain tissue from diffused slice 16 of Data Set 1.
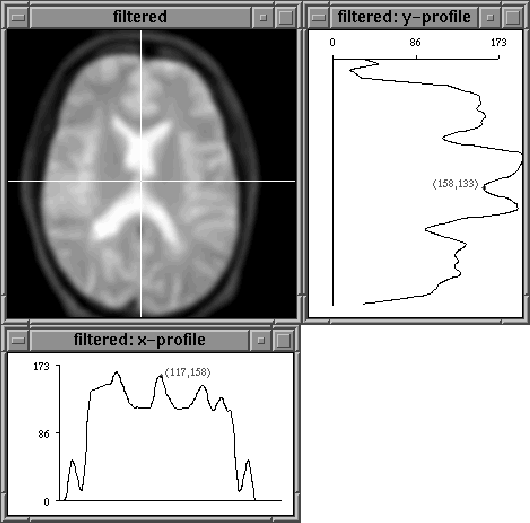
Figure 7.7: A diffused MR image slice. A
threshold set at 86 would eliminate non-brain pixels.
mriGetBrainThres automatically determines a threshold level for segmenting brain tissues from the diffused MR volume. It does so by fitting a gaussian to the histogram of the volume, then choosing levels at the specified number of standard deviations from the mean. Figure 7.8 contains the hierarchical igraph for mriGetBrainThres. Table 7.3 describes its operators.

Figure 7.8: WiT igraph implementing mriGetBrainThres.
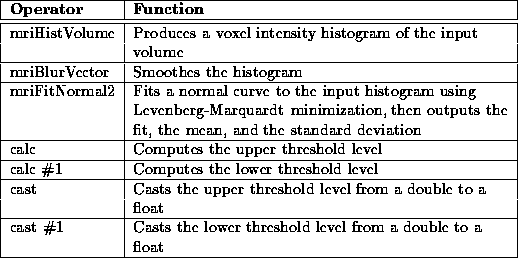
Table 7.3: A brief
description of the operators used in the mriGetBrainThres
hierarchical igraph.
This method of automatic threshold detection was suggested by Brummer et al. [7]. They use the technique to segment the brain from non-brain tissues in unfiltered MR scans. Section 2.6 of this manuscript shows that voxel intensities within the brain in T2-weighted MR volumes are not normally distributed. However, the regularization achieved by diffusion filtering results in a distribution that is close to normal. Figure 7.9 shows the voxel intensity histogram of the diffused Data Set 1 volume with the best fit gaussian curve overlaid. The upper and lower threshold levels are superimposed.
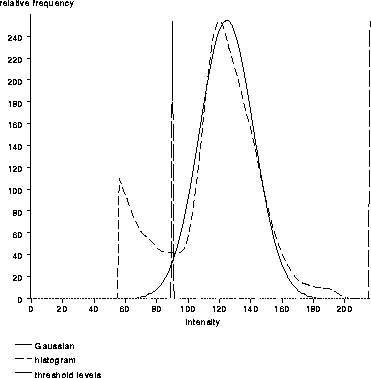
Figure 7.9: A histogram of
the diffused T2-weighted MR scan with the best fit gaussian curve and
threshold levels overlaid.
Brummer et al. suggest setting the lower threshold level to 2 standard deviations below the mean. The upper threshold level has been set to 6 standard deviations above the mean so that practically all high intensity pixels are included in the thresholded image. These levels have proven reasonable for all the data sets presented herein.
Referring back to the Generate Initial Brain Mask igraph in Figure 7.6, thres thresholds each slice of the diffused MR volume at the levels detected by mriGetBrainThres. Figure 7.10 illustrates the results for slice 8 of Data Set 1.
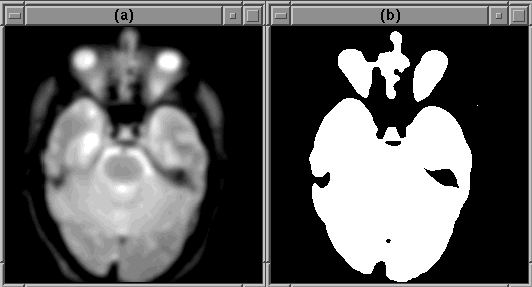
Figure 7.10: A binary mask produced by
thres in the Generate Initial Brain Mask igraph. (a) The
diffused image slice. (b) The corresponding binary mask.
The binary mask includes non-brain regions, such as the eyes, and misclassified regions within the brain. These errors can be eliminated using morphology and spatial information.
Non-brain regions are removed from the initial binary brain mask in much the same way that ``noise'' was removed from the head mask in the Segment Head process. mriFillBlobs fills in misclassified regions within the brain. berode separates weakly connected blobs and removes small blobs. mriGetBrainBlobs removes non-brain regions using expert knowledge and spatial information (it is a hierarchical WiT igraph). bdilate restores the blobs corresponding to brain regions to their original size. collector #2 builds a 3D mask from the set of 2D masks. display #2 displays and outputs the result.
Figure 7.11 shows the mask from slice 8 of Data Set 1 at each stage of this process.
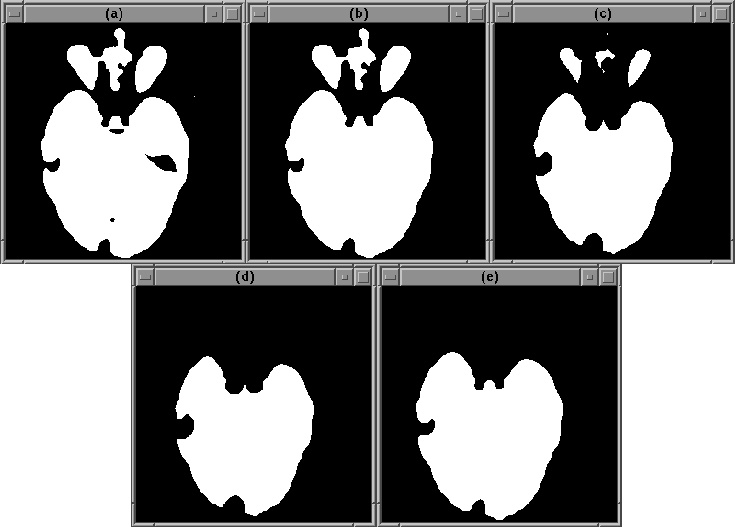
Figure 7.11: Elimination of misclassified
regions in the brain mask. (a) The mask produced by thres. (b)
The output of mriFillBlobs. (c) The output of berode. (d)
The output of mriGetBrainBlobs. (e) The output of bdilate.
Figure 7.12 contains the igraph for mriGetBrainBlobs. Table 7.4 lists its operator functions. The three significant operators in the igraph are minSizeFeatures, mriGetBrainFeatures, and mriGetLargestFeatures.

Figure 7.12: The WiT
hierarchical igraph implementing mriGetBrainBlobs.
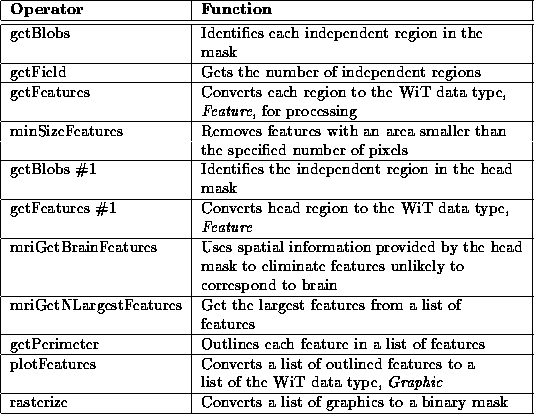
Table 7.4: A brief
description of the operators used in the mriGetBrainBlobs
hierarchical igraph.
minSizeFeatures removes features that have an area less than the specified number of pixels. Experiments have shown that features smaller than 50 pixels (after erosion) do not correspond to brain regions.
mriGetBrainFeatures uses spatial information from the head mask produced by the Segment Head process to remove features, such as the eyes, that are unlikely to correspond to brain tissue. It does so by eliminating features whose centroids fall outside the specified region within the head. Figure 7.13 illustrates the procedure. The shown parameters were selected experimentally to produce consistent results for all slices of all data sets presented in this manuscript.
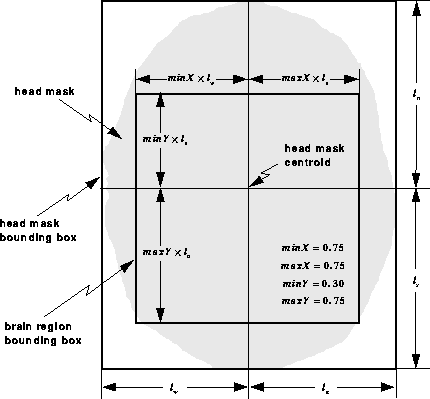
Figure 7.13: Spatial information from the
head mask is used to eliminate regions that are unlikely to correspond
to brain tissue. Features whose centroids fall outside the brain
region bounding box are discarded.
mriGetNLargestFeatures picks the largest features from the list of features provided. Visual inspection of all the data sets herein reveals that there are seldom more than 3 disconnected regions per slice that correspond to brain tissue.