2.3 RF Inhomogeneity


Next: 2.4 Partial Volume Effect
Up: 2 MR Imaging and
Previous: 2.2 Basic Principles of
MR images contain unwanted intensity variation due to inhomogeneity in
the ``uniform'' magnetic field,  , inhomogeneity in the applied
RF pulse sequence,
  , nonuniformity in RF field coil(s) used
to measure the FID response signal, and nonuniform loading of the
coils by the patient [41][5]. The overall intensity
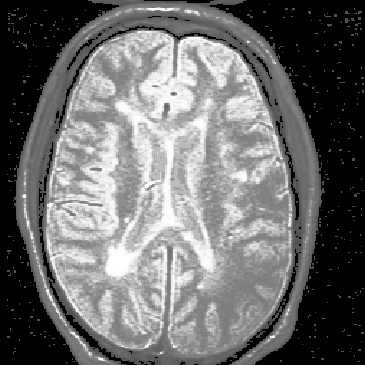
variation, referred to as RF inhomogeneity, is illustrated in
Figure 2.4.

Figure 2.4: An axial MR slice exhibiting intensity
variation due to RF inhomogeneity. Notice that the image intensity
drops in the lower right corner.
As mentioned in Chapter 1, RF inhomogeneity is
problematic for MS lesion segmentation algorithms that assume that
similar tissue types have similar intensities throughout the MR
volume [23][22][25][11]. We therefore
wish to reduce RF inhomogeneity in the MR images to improve the
results of the segmentation algorithms.
We use brain tissue intensity profiles to illustrate variations in
image intensity due to RF inhomogeneity. The tissue intensity profiles
show the average intensity of brain tissue voxels in the x, y, and z
directions. The profile is produced for each direction by averaging
voxels in the other two dimensions. For our MR images, the
z-dimension corresponds to the axial direction, looking up through the
patient's neck to the top of his/her head. The y-dimension begins at
the tip of the patient's nose and ends at the back of his/her head.
The x-direction extends from ear to ear.
Figure 2.5 shows the brain tissue intensity profiles
for the same MRI volume from which the slice in
Figure 2.4 was taken. In the absence of RF
inhomogeneity, each of the profiles should be roughly
symmetric. Notice, however, that they are not.

Figure 2.5: Brain tissue intensity
profiles show that intensity variation due to RF inhomogeneity exists
in the MR volume.
Brain tissue intensity variance measures can be used to reinforce the
intensity profiles. These measures are computed as the statistical
variance of the values in each of the directional profiles.
Table 2.1 lists the variances corresponding to the
intensity profiles given in Figure 2.5. Obviously,
the goal of intensity correction will be to flatten the intensity
profiles and reduce the variances.

Table 2.1: Brain tissue intensity
variances in each dimension.


Next: 2.4 Partial Volume Effect
Up: 2 MR Imaging and
Previous: 2.2 Basic Principles of
Blair Mackiewich
Sat Aug 19 16:59:04 PDT 1995
 , inhomogeneity in the applied
RF pulse sequence,
  , nonuniformity in RF field coil(s) used
to measure the FID response signal, and nonuniform loading of the
coils by the patient [41][5]. The overall intensity
variation, referred to as RF inhomogeneity, is illustrated in
Figure 2.4.


