This section describes experiments performed using 1D, 2D, and 3D anisotropic diffusion filters. The 1D filter operates on floating-point arrays. The 2D and 3D filters operate on 8-bit images and volumes, utilizing lookup tables for speed. The 2D filter uses 4 nearest neighbors and the 3D filter uses 6 nearest neighbors. All filters use the diffusion function defined by Equation 4.3 and are nonconvergent.
The 1D filter was used to illustrate the edge detecting and noise reduction capabilities of the filter. The 2D and 3D filters were used to detect edges in MRI data sets. The goal is to detect the intracranial boundary in the MR data sets and/or correct for RF inhomogeneity.
Figure 4.5 shows the effects of 1000 iterations of
the filter on a smoothed unit-step function for  .
. ![]() Figure 4.6 shows the same response for
Figure 4.6 shows the same response for  . By adjusting
  , the filter can be tuned to preserve or
destroy edges.
, the filter can be tuned to preserve or
destroy edges.
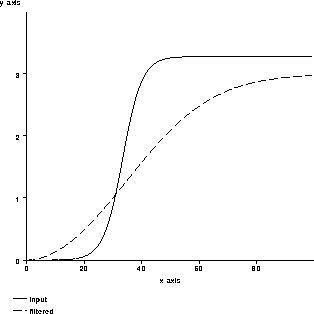
Figure 4.5: An example of nonlinear
isotropic diffusion smoothing an edge.
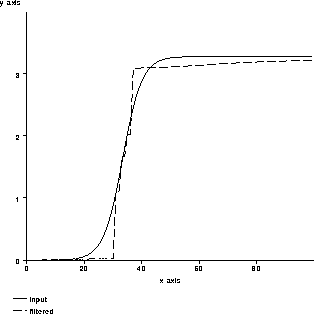
Figure 4.6: An example of nonlinear
isotropic diffusion tracking an edge.
Figure 4.7 shows the behavior of the 1D filter over 100 iterations for a smoothed unit-step function and a unit-step function with noise added. Notice that the filter can track the edge while filtering out the noise.
Figure 4.7: An example of diffusion
filtering reducing noise. (top) unit-step, (bottom) unit-step with
noise added
Figure 4.8 shows the results of filtering the 168th column (in 1D) of the fifth PD-weighted slice of MRI Data Set 1 described in Section 8.2. The filter seems to track the brain tissue fairly well.
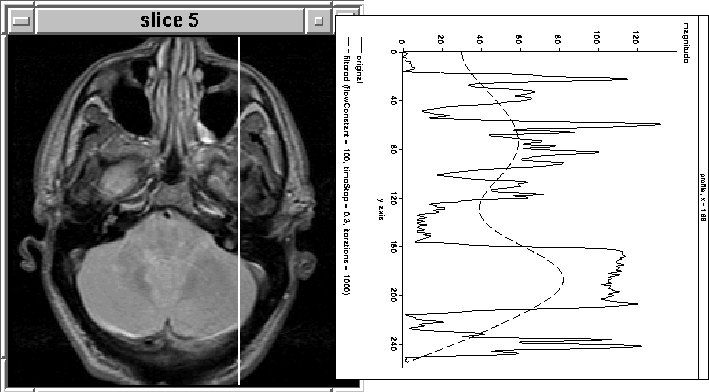
Figure 4.8: Intracranial
boundary detection using 1D nonlinear anisotropic diffusion
filtering.
Figures 4.9 and 4.10 show the results
of adjusting the number of filter iterations and the flow constant,
. In Figure 4.10 the filter precisely tracks
the brain tissue while attenuating other tissues. Further, it appears
to have produced a profile of the RF inhomogeneity over the brain in
the image. Here, the tissues corresponding to brain matter could
easily be segmented using a simple threshold.
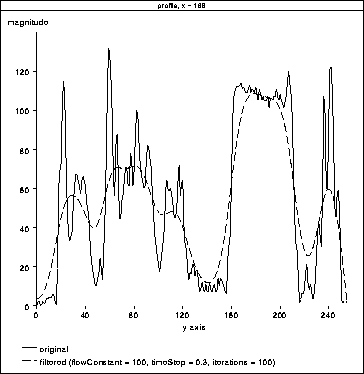
Figure 4.9: 1D Diffusion. The
filter appears to be tracking the data between  and
and
 . This region corresponds to brain tissue.
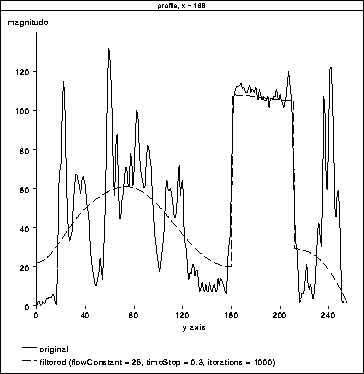
Figure 4.10: 1D
Diffusion. The filter has precisely tracked the brain tissue. It also
appears to have tracked the RF inhomogeneity across the brain.
Figure 4.11 illustrates the result of filtering column
160 from another slice (10) using the same parameters as in
Figure 4.10. ![]() Unfortunately, in this case the filter
does not attenuate the intensity of the eyes.
Unfortunately, in this case the filter
does not attenuate the intensity of the eyes.
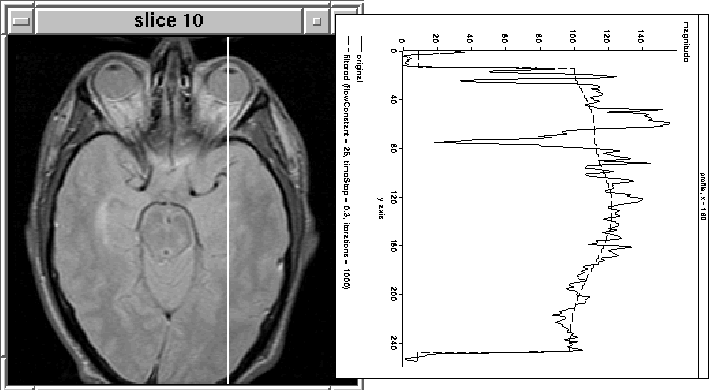
Figure 4.11: 1D Diffusion. The filter has
not attenuated the eye tissue as desired.
The 1D experiments are encouraging, but inconclusive. In some cases, filtering isolates the intracranial boundary, in others it does not. The image slice from the previous experiment was then filtered using the 2D filter. The results are shown in Figure 4.12 for 2 sets of filter parameters. Although the intensity of tissues outside the brain has been decreased, a simple threshold is unlikely to remove all those tissues. Still the intensity reduction is likely to simplify an intensity-based segmentation approach.
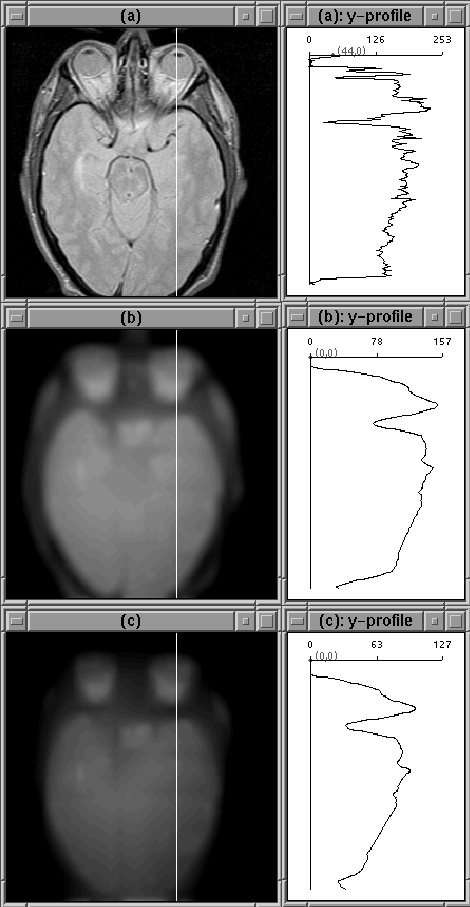
Figure 4.12: Images after 100 iterations of 2D
diffusion. (a) Original Image. (b) Diffused image,  .
(c) Diffused image,
.
(c) Diffused image,  . The filter has not attenuated
the eye tissue as desired.
. The filter has not attenuated
the eye tissue as desired.
The image cross-sections shown in 4.12 show that a reasonable profile of RF inhomogeneity was not produced by the diffusion process. The filter parameters cannot be adjusted so that the filter simultaneously attenuates non-brain regions, tracks the edge of the brain, and profiles RF inhomogeneity.
Figure 4.13 shows the same slice used in the previous 2 experiments before and after filtering with the 3D nonlinear anisotropic diffusion filter. The images are similar to the 2D case.
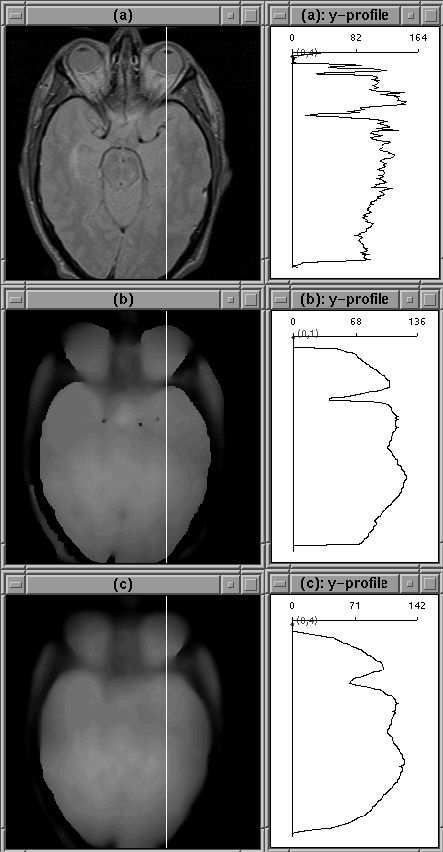
Figure 4.13: Images after 100 iterations of 3D
diffusion. (a) Original Image. (b) Diffused image,  .
(c) Diffused image,
.
(c) Diffused image,  .
.
Figure 4.14 shows the third slice of Data Set 1 before and after 3D diffusion. Filtering appears to have increased the partial volume effect here. Such a characteristic is undesirable since it makes the problem of finding a sharp edge difficult.
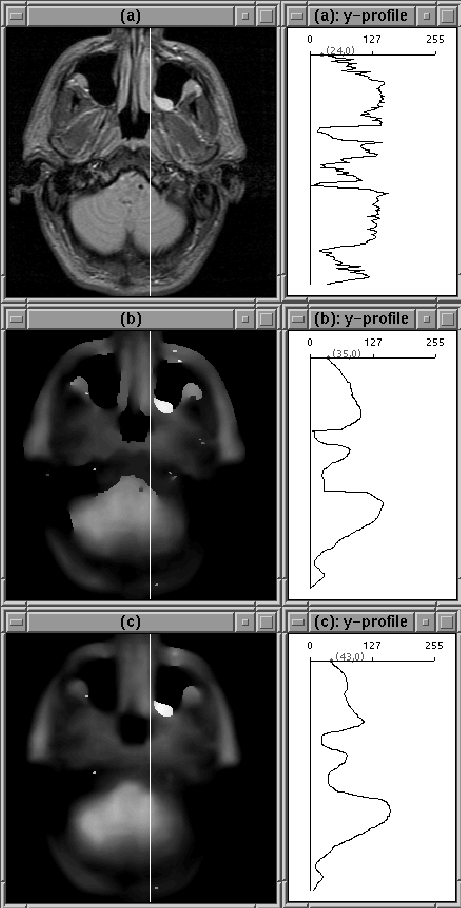
Figure 4.14: Images after
100 iterations of 3D diffusion. (a) Original Image. (b) Diffused
image, . (c) Diffused image, . The
edges of the brain have become unclear due to increased partial
volume effects.
3D diffusion filtering is slower than the 2D case and does not seem to offer any advantages for the clinical MR data presented. In fact, 3D filtering appears to worsen the partial volume effect. This result is expected because the data set was acquired as a sequence of 2D slices, not as a 3D volume.
The 1D diffusion filter was developed for illustration purposes only: it will not be used by the intracranial boundary detection algorithm described in this manuscript. Therefore, its execution time was not measured.
The 2D diffusion filter executes at a rate of about 51 milliseconds
per iteration for 8-bit unsigned  pixel images on a
Sun SPARC 5 Workstation with 16 MBytes of RAM.
pixel images on a
Sun SPARC 5 Workstation with 16 MBytes of RAM.
The 3D diffusion filter executes at a rate of about 100 milliseconds
per iteration for an 8-bit unsigned voxel image
slice on a Sun SPARC 5 Workstation with 16 MBytes of RAM.