Exploring Shapes
In these notes you will learn how to draw:
- Straight-line shapes such as points, lines, ellipses, rectangles, and quads.
- Curves using the
arc(),curve(), andbezier()functions. - More complex shapes using
beginShape(),vertex(), andendShape().
Drawing Straight-line Shapes
Processing comes with a number of functions for drawing 2-dimensional shapes. It also has support for 3-dimensional shapes, like spheres and cubes, but we will stick to 2-dimensional graphics in this course.
Points
The Processing function point(x, y) draws a single-pixel point at
location (x, y) on the screen, e.g.:
void setup() {
  size(500, 500);
}

void draw() {
  stroke(255, 0, 0);  // make the points red
  point(mouseX + 5, mouseY + 5);
  point(mouseX - 5, mouseY - 5);
  point(mouseX + 5, mouseY - 5);
  point(mouseX - 5, mouseY + 5);
}
You can set the color of a point using stroke.
Lines
The Processing function line(x, y, a, b) draws a straight-line segment
between the points (x, y) and (a, b). Here’s a sample program
that draws some “line art”:
void setup() {
  size(500, 500);
}

void draw() {
  background(255);

  line(0, 0 * 50, 0 * 50, 450);
  line(0, 1 * 50, 1 * 50, 450);
  line(0, 2 * 50, 2 * 50, 450);
  line(0, 3 * 50, 3 * 50, 450);
  line(0, 4 * 50, 4 * 50, 450);
  line(0, 5 * 50, 5 * 50, 450);
  line(0, 6 * 50, 6 * 50, 450);
  line(0, 7 * 50, 7 * 50, 450);
  line(0, 8 * 50, 8 * 50, 450);
  line(0, 9 * 50, 9 * 50, 450);
}
The * means “multiply”, and so 2 * 50 is 100, 7 * 50 is 350, etc.
We’ve written the numbers in this form to make the pattern obvious.
Here’s a neat modification of this program, where the first 0 of each line
has been replaced by mouseX, and the final 450 has been replaced by
mouseY:
void setup() {
  size(500, 500);
}

void draw() {
  background(255);

  line(mouseX, 0 * 50, 0 * 50, mouseY);
  line(mouseX, 1 * 50, 1 * 50, mouseY);
  line(mouseX, 2 * 50, 2 * 50, mouseY);
  line(mouseX, 3 * 50, 3 * 50, mouseY);
  line(mouseX, 4 * 50, 4 * 50, mouseY);
  line(mouseX, 5 * 50, 5 * 50, mouseY);
  line(mouseX, 6 * 50, 6 * 50, mouseY);
  line(mouseX, 7 * 50, 7 * 50, mouseY);
  line(mouseX, 8 * 50, 8 * 50, mouseY);
  line(mouseX, 9 * 50, 9 * 50, mouseY);
}
Ellipses and Rectangles
In Processing, the ellipse(x, y, width, height) draws an ellipse of the
given width and height centered at the point (x, y) on the screen. For
instance:
void setup() {
  size(500, 500);

  smooth();  // this often makes curves look smoother
  noFill();  // just draw the edges of the ellipses
}

void draw() {
  background(255);

  // by default, an ellipses is position by its center point
  ellipse(mouseX, mouseY, 200 + 0 * 50, 75 + 0 * 50);
  ellipse(mouseX, mouseY, 200 + 1 * 50, 75 + 1 * 50);
  ellipse(mouseX, mouseY, 200 + 2 * 50, 75 + 2 * 50);
  ellipse(mouseX, mouseY, 200 + 3 * 50, 75 + 3 * 50);
  ellipse(mouseX, mouseY, 200 + 4 * 50, 75 + 4 * 50);
}
The function rect(x, y, width, height) draws an ellipse of the given width
and height whose upper-left corner is at the point (x, y) on the
screen. For instance:
void setup() {
  size(500, 500);

  noFill();  // just draw the edges of the rectangles
}

void draw() {
  background(255);

  // by default, a rectangle is positioned by its upper-left corner
  rect(mouseX, mouseY, 200 + 0 * 50, 75 + 0 * 50);
  rect(mouseX, mouseY, 200 + 1 * 50, 75 + 1 * 50);
  rect(mouseX, mouseY, 200 + 2 * 50, 75 + 2 * 50);
  rect(mouseX, mouseY, 200 + 3 * 50, 75 + 3 * 50);
  rect(mouseX, mouseY, 200 + 4 * 50, 75 + 4 * 50);
}
This program shows the difference between how ellipses and rectangles are specified:
void setup() {
    size(500, 500);

    noFill();  // just draw the edges
}

void draw() {
    background(255);

    rect(mouseX, mouseY, 100, 175);
    ellipse(mouseX, mouseY, 100, 175);
}
By default, a rectangle is positioned by it’s upper-left corner, while an ellipse is positioned by it’s center.
Triangles
A triangle is, of course, a 3-sided polygon. In this sample program, we draw an animated triangle whose area never changes:
void setup() {
  size(800, 200);
}

void draw() {
  background(255);  // white background

  triangle(350, 5,           // top corner
           mouseX, 190,      // left bottom corner
           mouseX + 75, 190  // right bottom corner
          );
}
Recall that the area of a triangle is half its height times it base, and so the area of the triangle in this program is fixed because its height and base are always the same.
Quads
In Processing, a quad is a quadrilateral, i.e. a polygon with 4 sides.
The function quad(a, b, c, d, e, f, g, h) specifies the four corners of
the quad: (a, b), (c, d), (e, f), and (g, h).
Here’s an example of how to use quads:
void setup() {
  size(500, 500);

  noStroke();
}

void draw() {
  background(200);
  quad(mouseX, mouseY,
       mouseY, mouseX,
       500 - mouseX, mouseY,
       mouseX, 500 - mouseY
      );
}
When you try this program, notice that the edges of the quad can cross, resulting in a bow-tie shape.
Drawing Curves
Arcs
The Processing function arc draws a portion of the edge of an ellipse,
i.e. an arc. It takes 6 or 7 inputs:
arc(x, y, w, h, startAngle, stopAngle, [drawMode])
The first four parameters are the same as for the ellipse function:
(x, y) is the center of the ellipse, and w and h are its width
and height. The values startAngle and stopAngle specify the angle at
which the arc should start, and the angle at which it should end.
The arc function expect angles to be in radians. However, it is
usually more convenient for us humans to specify angles in degrees.
Processing has a function called radians(d) that converts a number of
degrees, d, into radians. So we will use that whenever we need to specify
an angle.
The final parameter, drawMode, is optional: it specifies how the arc
should be drawn.
Here’s a sample program that lets you move an arc around the screen:
void setup() {
  size(500, 500);

  smooth();
  noFill();
}

void draw() {
  arc(mouseX, mouseY, 150, 150, radians(0), radians(90));
}
This draws a quarter of the edge of the circle. Try changing the 0 and 90 to other values to see the variety of arcs that can be drawn.
In this next sample, the arc changes as it moves around the screen. We’ve also
drawn it with the CHORD drawing mode, so that the end points of the arc
are connected with a line:
void setup() {
    size(500, 500);

    smooth();
    noFill();
}

void draw() {
    background(255);  // white background
    arc(mouseX, mouseY, 150, 150, radians(mouseY), radians(mouseX), CHORD);
}
Curves
Another way to draw curves with Processing is to use the curve function,
which implements a kind of curve known as a Catmull-Rom spline.
The input to the curve function is as follows:
curve(x1_anchor, y1_anchor,  // first control point
      a, b,                  // first point
      c, d,                  // second point
      x2_anchor, y2_anchor   // second control point
     );
Here’s a sample program that draws an interactive curve:
void setup() {
  size(500, 500);

  smooth();
}

void draw() {
  background(255);
  stroke(0);
  strokeWeight(50);
  curve(mouseX, mouseY, 15, 20, 485, 420, 250, 250);
}
Bezier Curves
The Processing functions bezier, bezierPoint, bezierVertex, and
bezierTangent are used to draw various Bezier curves. Bezier curves. They have many
applications in computer graphics and animation.
The input to the bezier function is as follows:
bezier(x1_anchor, y1_anchor,    // first anchor point
       a1_control, b1_control,  // first control point
       a2_control, b2_control,  // second control point
       x2_anchor, y2_anchor     // second anchor point
      );
Here’s a simple example of how the bezier function can make a variety of
curves:
void setup() {
  size(500, 500);

  smooth();
}

void draw() {
  background(255);
  stroke(0);
  strokeWeight(50);
  bezier(15, 20, mouseX, mouseY, mouseY, mouseX, 485, 420);
}
The stroke(0) functions sets the color of the line to black, while
strokeWeight(50) sets its thickness to be 50 pixels.
We won’t expect you to memorize any of the details of Bezier curves in this course. Check their Wikipedia page if you are interested in learning more about them.
Drawing More Complex Shapes
Processing provides a few ways to draw shapes made up of multiple points. For
instance, using beginShape, vertex, and endShape, you can draw
polygons like this:
void setup() {
  size(500, 500);
}

void draw() {
  background(255);
  beginShape();
  vertex(100, 100);
  vertex(200, 100);
  vertex(200, 200);
  vertex(300, 200);
  vertex(mouseX, mouseY);
  vertex(300, 300);
  vertex(100, 300);
  endShape(CLOSE);
}
The beginShape function can take parameters as input, e.g.
beginShape(POINTS) will draw just the points of the shape, and not the
edges. See the Processing documentation
for more functions, plus examples of how to use them.
Questions
Briefly describe in clear, simple English what each of the following Processing functions do:
point,arc, andquad.Don’t just say “draws a point”, “draws an arc”, or “draws a quad”. Explain the kind of shape each function draws.
Suppose you draw a rectangle on the screen (without changing the drawing mode) like this:
rect(100, 200, 200, 400);
What are the coordinates of the center of this rectangle?
Suppose you draw an ellipse on the screen (without changing the drawing mode) like this:
ellipse(100, 200, 200, 400);
What are the coordinates of the center of this ellipse?
Programming Questions
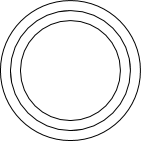
Combine the sample program for the Catmull-Rom spline and the sample program for Bezier curves into a single program so that both curves are on the screen at the same time. Use
fillto make them different colors, e.g. putfill(255, 0, 0);just before the first curve, andfill(0, 0, 255);just before the second curve.Write a program that draws this shape centered at the mouse pointer:

It should not leave a trail when it moves.
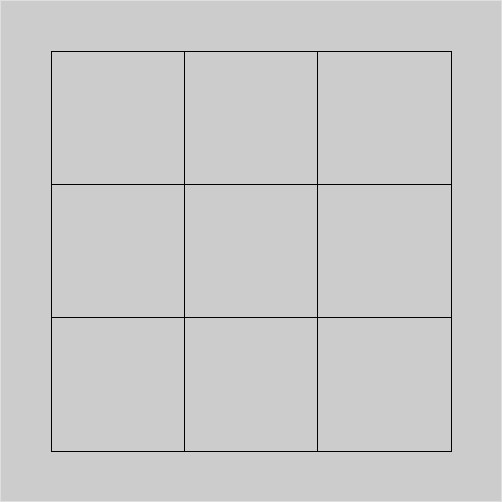
Draw the following figure, consisting of 9 small squares, using exactly 3 calls to
rect:
There’s no animation in this question: just write the code that draws this diagram.
Important: you must make only 3 calls to
rect!You might want to use the noFill function in this program.
Make an animation of Pac Man using the
arcfunction. How exactly Pac Man moves is up to you.Use the
arcfunction to create a pie chart that is divided into 3 slices: one slices is 50% of the pie, another slice is 30% of the pie, and the final slice is 20% of the pie. Make the slices different colors.Write a program that animates (without a trail) two squares. The first square moves horizontally across the screen following the x-coordinate of the mouse. The second square moves vertically across the screen following the y-coordinate of the mouse.
Give the squares different colors using the fill function.
Write a program that draws a vertical line and horizontal line that intersect at the mouse pointer. The lines should go all the way across the screen, and move (without leaving a trail) as the mouse moves. Turn off the mouse pointer using the noCursor() function.

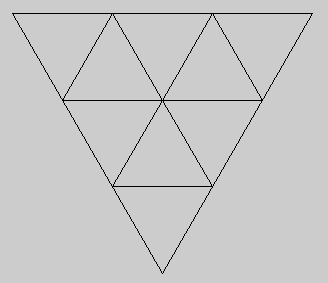
Draw the following figure using only four calls to the
trianglefunction:
There’s no animation in this question, just a single static image.
Important: you must make only 4 calls to
triangle!You might want to use the noFill function in this program.
Write a program that draws an interesting, unique, and non-trivial picture that moves (without leaving a trail) wherever the mouse pointer goes. Use at least 5 shapes drawn with Processing functions.
For example, you could create a car, or a robot, or an airplane.
Try to make your program fun, e.g. something that might impress a little kid for a minute or two.