3. Smoothing, Coordinates, and Modes
In these notes you will learn:
- How screen resolutions are specified.
- How to specify points on the Processing screen.
- How to change Processing‘s drawing modes.
- What the Processing smooth() function does.
3.1. Introduction
In animation and graphics programming, it’s important to know how to specify the location of objects on the screen. So in this note we’ll see how screen coordinates work in Processing.
3.2. Screen Resolution
Conceptually, most computer screens are a rectangular grid of pixels. Recall that a pixel is the smallest region of colour on the screen that we can change. When we talk about a point on the screen, we usually mean a pixel.
The width and height of the screen in pixels is known as its resolution. For example a big desktop monitor may have a resolution of 1920 by 1080 pixels (although the ‘p’ in 1080p doesn’t stand for pixels!)
Making programs work on screens with different resolutions is surprisingly tricky, and many professional graph designers simply ignore the issue and work at a fixed resolution. In this course we will do the same, and assume that our programs will always be displayed on a monitor with at least 500 by 500 pixels.
3.3. (x, y) Points on the Processing Screen
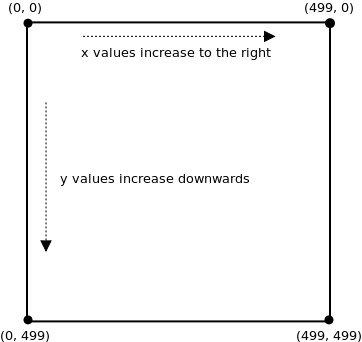
As in mathematics, Processing uses (x, y) coordinates to label every pixel on the screen: x is the row and y is the column. Unlike the way we usually do it in mathematics, in which we have the origin at the bottom-left corner of the quadrant, Processing has the origin at the top-left.
Suppose the screen is 500 pixels by 500 pixels. Then the pixel at the upper-left corner is (0, 0), and the pixel at the lower-right corner is (499, 499).
For example, if the screen were 5 x 5 pixels, then the pixels would have these coordinates:
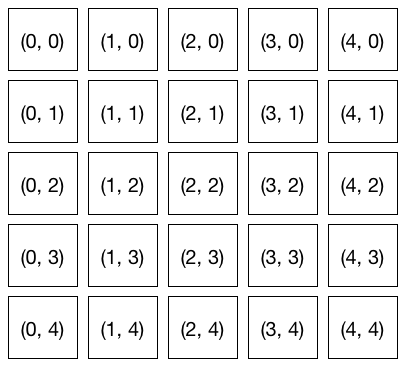
Why does the bottom-right corner have coordinates (4, 4) instead of (5, 5)? The reason is that we started counting pixels at 0, rather than 1. You’ll find that most of the time we’ll start counting at 0 which may be the cause of a very common mistake known as an off-by-one error.
As the diagram above shows, the x-values increase from left to right, and the y-values increase from top to bottom. In other words, the y value’s direction is the opposite of what we’re used to! This can get a little confusing sometimes, when we use an equation (e.g. for a line) to draw a shape. However, it is an unfortunate reality that we must deal with.
3.4. Example: Drawing a Diagonal Line
Suppose you want to draw a diagonal line from the lower-left corner of the screen to the upper-right corner, e.g.
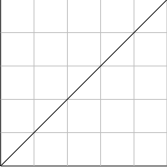
For simplicity, assume the screen is 5 x 5 pixels.
Recall from math class that the equation for this line is  . But that doesn’t quite work here for two reasons:
- y-values in Processing coordinates increase from top to bottom, not bottom to top;
- The equation
 makes the line go to through the origin,
i.e the point (0, 0). But here our line does not go anywhere near
(0,0) (which is the top-left corner of the screen).
makes the line go to through the origin,
i.e the point (0, 0). But here our line does not go anywhere near
(0,0) (which is the top-left corner of the screen).
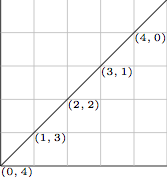
Let’s look at the coordinates of the plotted points to see what is going on:
How are the  and
and  values related in these points?
Notice that they sum to 4, i.e.
values related in these points?
Notice that they sum to 4, i.e.  for each point.
Re-arranging that a bit to get an equation of a line gives us the equation
for each point.
Re-arranging that a bit to get an equation of a line gives us the equation

And that’s the line we want: . The takes care
of the flipped y-axis, and the 4 moves the line away from the origin.
What we’ve done is convert the equation  from the coordinate
system we know, to the Processing coordinate system.
from the coordinate
system we know, to the Processing coordinate system.
We can also convert the coordinate system itself. Given a point  in the standard coordinate system
we can convert it to a screen coordinate system by mapping to the screen coordinate
system. See the questions
in the standard coordinate system
we can convert it to a screen coordinate system by mapping to the screen coordinate
system. See the questions
3.5. Example: Mirror Drawing
Recall this program, which draws an ellipse wherever the mouse point goes:
void setup() {
  size(500, 500);
}

void draw() {
  ellipse(mouseX, mouseY, 10, 10);
}
With a bit of arithmetic, we can create a mirror effect:
void setup() {
size(500, 500);
}
void draw() {
ellipse(mouseX, mouseY, 10, 10);
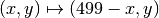
// reflected point
ellipse(499 - mouseX, mouseY, 10, 10);
}
In this version, every time draw() is called two circles are drawn:
one at the mouse position, and one at the reflection of the mouse position
about the vertical centre line of the screen. If we had no limits on our screen
We would have 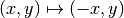 . But we need to account for the
fact that the screen is 500 pixels wide, so we have
. But we need to account for the
fact that the screen is 500 pixels wide, so we have
3.6. Plotting Points
We’ve seen that Processing has functions for plotting shapes (such as rectangles and ellipses), but sometimes we may want to plot individual points. There are a couple of ways to do this.
One way to plot a point is Processing is to use the point(x, y) function, e.g.:
void setup() {
   size(5, 5);
}

void draw() {
  point(4, 0);
  point(3, 1);
  point(2, 2);
  point(1, 3);
  point(0, 4);
}
Of course, a 5 by 5 window is pretty small, so you might have to look hard to see the line.
Another common way to plot points is to draw small shapes, such as circles or rectangles. This way you have control over the size, colour, and shape of the point, which is useful when, say, plotting data on a graph. Lets plot a point in the middle of a 500 x 500 window:
void setup() {
  size(500, 500);
}

void draw() {
  ellipse(500 / 2, 500 / 2, 10, 10);
}
The call to ellipse in draw() plots a circle of size 10 in the middle of the screen, i.e. at coordinates (250, 250). The / is division, and we use it here to show that Processing can do arithmetic for you.
3.7. Drawing Modes
When you call ellipse(0, 0, 200, 200), it draws a circle centred at location (0, 0):
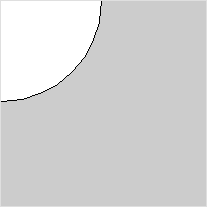
Since (0, 0) is the upper-left corner of the screen, only a quarter of the circle is visible: three-quarters of it are off-screen.
If you want to, you can how Processing positions a circle using the ellipseMode function. For example, this code sets the upper-left corner of the ellipse at (0, 0):
ellipseMode(CORNER);
ellipse(0, 0, 200, 200);
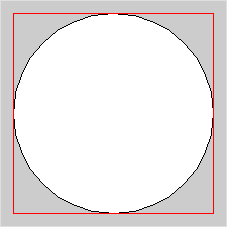
Now the entire circle is visible:
The “corner” of the ellipse means the corner of the smallest rectangle that can be drawn around the ellipse (and whose edges are parallel to the size of the screen). This surrounding rectangle is known as the bounding box for the ellipse, and it’s a common way to specify the size and position of a graphical object.
Rectangles drawn with rect(x, y, width, height) also have a mode that you can set with rectMode. By default, the (x, y) in a call to rect is the location of the rectangle’s upper-left corner. You can change it to be the centre like this:
rectMode(CENTER);
rect(0, 0, 50, 50);
What drawing mode to use it entirely up to you. You never need to change it, but sometimes it might be convenient. We will occasionally change drawing mode when it is useful.
3.8. The smooth() Function
As you’ve no doubt seen, computer images can have jagged-looking lines for edges that ought to be smooth. For example, drawing a perfectly horizontal or vertical lines is easy (each * represents a pixel):
**************     *
                   *
                   *
                   *
                   *
But slanted lines necessarily have some jagged edges, e.g.:
**
  **
    **
      **


          *****
     *****
*****
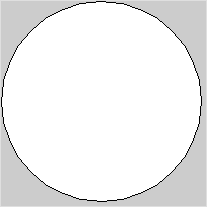
Processing has a function called smooth() that can help hide jagged edges by subtly changing the colors of the pixels around the jags (this technique is known as anti-aliasing). For instance, the circle on the left is smoothed, while the circle on the right is not:

The main downside of using smooth() is that it slows your program down: smoothing-out the pixels takes a little bit of extra time. For many small programs, though, this speed decrease is not noticeable. Thus we’ll often call smooth() in setup() as a simple way to make our output look a little nicer.
3.9. Questions
- What is a pixel?
- How many pixels are there on a screen with a resolution of 1920 x 1200? 640 x 400?
- Explain why smooth lines sometimes look jagged when displayed on a computer monitor.
- Describe the differences between the Processing screen coordinate system, and the coordinate system normally used in mathematics.
- Suppose you are working with a Processing screen that is 640
pixels high and 400 pixels wide. What, exactly, are the
coordinates of the point at:
- The upper-left corner?
- The upper-right corner?
- The lower-right corner?
- The lower-left corner?
- The middle of the screen?
- Describe how to translate the point to a Processing
coordinate system, given that the screen is
 pixels. Assume
 and
and  .
. - Describe two different techniques for plotting points in Processing.
- The ellipseMode function has more modes than are mentioned in the text. What are all the modes for ellipseMode?
3.10. Programming Questions
Write a program that draws 5 circles on a 500 x 500 screen at these screen locations:
- the upper-left corner
- the upper-right corner
- the lower-left corner
- the lower-right corner
- the middle
Make sure the circles are entirely visible, i.e. don’t let any part of them go off the screen.
Write a program that draws a circle and its bounding box, both centered in the middle of the screen. The circle should just touch the middle of each of the four sides of the box.
Make the size of the circle and box change with respect to the mouse pointer (i.e. use mouseX and mouseY to set their width and height) so that the shapes will get bigger or smaller when the mouse moves. They should always stay centered in the middle of the screen.
Using an image of your choice, write a program that draws three copies of that image on the screen, and all three images move in the same direction the mouse pointer moves.
Re-do the previous question except this time make the three images each move in different directions when you move the mouse pointer.
Modify the mirror-drawing program in the notes so that the circles drawn by the user are reflected through the horizontal center line.
Modify the mirror-drawing program so that three reflected circles are drawn (so there will be four circles drawn simultaneously). The three circles should reflect through:
- the horizontal center line
- the vertical center line
- both the horizontal and vertical center line