Statistics for Data Science
About Me
Senior Lecturer at Simon Fraser University in Vancouver, Canada.
Accidental data scientist.
Teach a 3rd year undergraduate Data Science course, and MSc-level Big Data lab course.
What is Data Science?
According to Wikipedia: an interdisciplinary field about processes and systems to extract knowledge or insights from data in various forms…
According to Pat Hanrahan, Tableau Software: [The combination of] business knowledge, analytical skills, and computer science.
According to Daniel Tunkelang, LinkedIn: [The ability to] obtain, scrub, explore, model and interpret data, blending hacking, statistics and machine learning.
What is Data Science?
According to Joel Grus: There's a joke that says a data scientist is someone who knows more statistics than a computer scientist and more computer science than a statistician.… We'll say that a data scientist is someone who extracts insights from messy data.
What is Data Science?
According to Drew Conway, Alluvium:
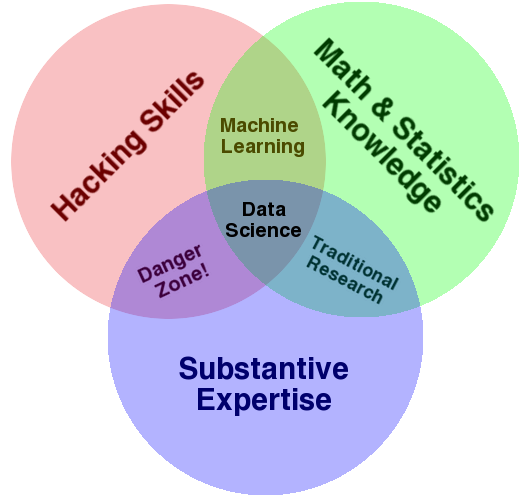
What is Data Science?
My working definition:
You get some data. Then what do you do to get answers from it? Whatever that is, that's data science.
Of course, one of those things is statistics.
Why Data Science?
Why is data science
suddenly so popular?
There's more data being collected: web access logs, purchase history, click-through rates, location history, sensor data, ….
Sometimes the volume of data is big: too big to manage easily, or with a single computer. That's where big data
usually starts.
Why Data Science?
People want answers/insights from that data: Is the marketing campaign working? Is the UI actually usable? What if we did X instead of Y?
New techniques: Machine learning lets us attack questions that were previously unanswerable. Computer scientists are realizing that statistics is important; statisticians are realizing that computer science is important.
Real Data
If this is like every other stats course in the world, data usually looks like this:
| Daily Users | Daily Page Views |
|---|---|
| 87 | 348 |
| 31 | 219 |
| 104 | 401 |
| 83 | 302 |
… and you're asked if users and page views have a linear relation.
Real Data
But data is rarely that beautiful when you find it. That data probably started as thousands of lines like:
www-d3.proxy.aol.com - - [01/Aug/1995:00:01:52 -0400] "GET /shuttle/missions/sts-71/mission-sts-71.html HTTP/1.0" 200 13450
in24.inetnebr.com - - [01/Aug/1995:00:01:54 -0400] "GET /shuttle/missions/sts-68/news/sts-68-mcc-09.txt HTTP/1.0" 200 2166
205.163.36.61 - - [01/Aug/1995:00:01:55 -0400] "GET /shuttle/countdown/countdown.html HTTP/1.0" 200 4324
205.163.36.61 - - [01/Aug/1995:00:01:57 -0400] "GET /shuttle/countdown/count70.gif HTTP/1.0" 304 0
rpgopher.aist.go.jp - - [01/Aug/1995:00:01:58 -0400] "GET /ksc.html HTTP/1.0" 200 7280
… and you have to figure out which line is from which day, which request comes from each user, etc. Then you can do some stats.
Real Questions
Also, questions don't usually come as nicely phrased as is there a linear relationship between number of users and page views?
They are often more like why has the number of users dropped?
or is the ad campaign working?
Data Pipeline
It's worth thinking of what happens to your data as a process:
- Figure out the question.
- Find/acquire relevant data.
- Clean & prepare the data.
- Analyze the data.
- Interpret & present results.
Data Pipeline
Figure out the question
should not be underestimated.
People don't usually ask questions that map to techniques you know. They don't always ask coherent questions that can be answered.
Data Pipeline
How you find/acquire relevant data
will depend on the problem. Maybe you have to…
- do some programming/sysadmin work to record what's happening in a system.
- do a survey, or collect the data some other way.
- join together separate data sets from across the company. (data warehousing)
- ⋮
Data Pipeline
Most working data scientists admit that clean & prepare the data
takes more than half of their time. Exactly how to clean the data requires understanding it.
e.g. For the web server logs: must parse the lines and aggregate the results by day/user. Need to decide what data matters: HTML vs all requests; redirects or errors; …
Data Pipeline
Most aspiring data scientists imagine analyze the data
as 100% of what they'll be doing. Could include techniques from…
- machine learning,
- data mining,
- signal processing,
- statistics,
- anything else that works.
Data Pipeline
Don't forget how important it is to interpret & present results
.
Clever results are useless if you don't tell anybody (or they don't understand).
Data Pipeline
This process is inter-disciplinary, but a CS student in a stats class has a good start.
- Figure out the question. ← domain-specific
- Find/acquire relevant data. ← programming, surveys, …
- Clean & prepare the data. ← programming
- Analyze the data. ← stats, machine learning, …
- Interpret & present results. ← communications
Inferrential Stats
Inferrential statistics are one way to get answers out of data… the one we care about today.
Inferrential Stats
Some basic inferential stats can get a lot of results out of data, but be aware of your limits.

Inferrential Stats
There are many statistical tests that might be useful.
For Python, SciPy's stats module implements 31 functions described as a test
and StatsModels has many more.
How can you make sense of that to get the answers you're looking for?
Inferrential Stats
Textbooks often describe tests like this, which is true but not very useful:
The t-test is any statistical hypothesis test in which the test statistic follows a Student's t-distribution under the null hypothesis. Wikipedia: Student's t-test
Inferrential Stats
A few sentences later is a description that's more useful, but not complete:
The t-test can be used, for example, to determine if two sets of data are significantly different from each other. Wikipedia: Student's t-test
Inferrential Stats
The basic idea:
Every test has a null hypothesis (\(H_0\)). We start by assuming that \(H_0\) is true. Usually \(H_0\) is nothing's happening
.
The test gives us a \(p\) value that tells us something about how unusual the data is, assuming \(H_0\).
If the \(p\) value is very small, we decide that \(H_0\) is likely false, so the opposite (\(H_a\)) is likely true.
If \(p\) isn't small, we have no conclusion.
Inferrential Stats
Basically, all inferential stats is like a proof by contradiction, but probabilistic.
Statistical Tests
What do you actually need to know about a statistical test to use it to get something done?
These are the things I want to know about a test:
- Assumptions it makes: the data must have these properties for the test to make sense.
- The null (and alternate) hypothesis: what will the test actually tell you if you reject the null?
- How can you interpret \(H_a\) as a
real
conclusion about the world?
Statistical Tests
So I understand the T-test as:
- Two populations with normal distributions and equal variances.
- Null: the means of the two populations are the same. \(H_0\colon\ \mu_A=\mu_B\) and \(H_a\colon\ \mu_A\ne\mu_B\).
- If \(p<0.05\), conclude that the two populations have different averages.
Doing Tests
How I actually do a T-test, with Python:
from scipy import stats

group1 = ...
group2 = ...

ttest = stats.ttest_ind(group1, group2)
print(ttest.pvalue)
Prints a \(p\) value, like:
0.017071681233782634
Abusing Tests
Remember: the \(p\) value is just a probability. Sometimes, you'll reach an incorrect conclusion (false positive) by chance.
When your data gets interesting, it's easy to abuse statistics to make mistakes.
Abusing Tests
If you have 10 groups in your data set, and start to use a T-test to find out if they're difference, you'll do \(C(10,2) = 45\) tests.
The probability of getting no false positives (with \(p<0.05\)) is then
\[ 0.95^{45} = 0.09944\,. \]So you're very likely to find something incorrect by accident.
Abusing Tests
Don't belive math? What about code?
When I run that, I find two significantly different
results, even though all the data is from the same distribution.
Abusing Tests
Be careful of doing this by accident: trying one test after another and ignoring the ones that don't give results.
It's called p-hacking. See also the Bonferroni correction to avoid it.
Approaching Data
So when you have some imperfect questions and data, how do you start?
It's important to have a plan for your analysis: what test(s) are you going to do? If you have an honest plan before you start, then you won't be p-hacking.
Approaching Data
Then you have to decide if your data meets the assumptions of your test.
e.g. Are the groups (close enough to being) normally distributed, so you can do a T-test? Are the variances the same (or similar)?
Conclusion
There is a lot more to data analysis than just statistics, but statistics is an important tool to have available.
Conclusion
More?
Great book that's free online: Python Data Science Handbook, Jake VanderPlas.
See everything implemented in Python: Data Science from Scratch, Joel Grus
Come take my course? SFU's Professional Master's Program in Big Data.