Ethics in Data Science
About Me
Senior Lecturer at Simon Fraser University in Vancouver, Canada.
Accidental data scientist.
Teach a 3rd year undergraduate Data Science course, and MSc-level Big Data lab course.
What is Data Science?
According to Drew Conway, Alluvium:
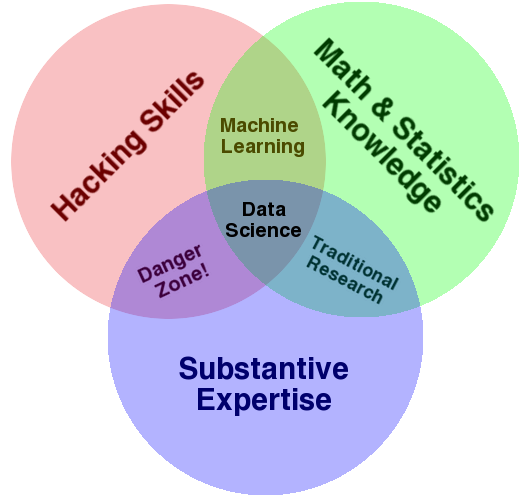
What is Data Science?
There are several steps to a data pipeline
like these:
- Figure out the question.
- Find/acquire relevant data.
- Clean & prepare the data.
- Analyze the data.
- Interpret & present results.
What is Data Science?
Analyzing data can happen in many ways, such as:
- machine learning,
- data mining,
- signal processing,
- statistics,
- anything else that works.
What is Data Science?
Let's talk about some ways you can be dishonest in that process, either deliberately or accidentally…
Honest Questions
Often, the exact details of the question you ask will determine the answer.
It's often easy to change the question just a little to get a different answer. e.g. which politicians are better for the economy?
Getting Data Honestly
Experimental design is an important thing if you're gathering data.
Asking the wrong question or sampling non-uniformly can completely change the results.
Getting Data Honestly
Any other way you're gathering data needs at least a little attention to getting a fair sampling of the data.
e.g. The GHCN data has many more weather stations in North America and Western Europe. If you want global averages, you might need to correct for that.
Honest Cleaning
Problems with your data have to be fixed: data cleaning.
Cleaning often requires human judgment, so it's easy to introduce bias.
Honest Cleaning
But cleaning is important. This outlier makes it look like negative correlation:

Honest Cleaning
Remove the outlier, and the correlation looks much more meaningful:

Honest Cleaning
Was it okay to remove that outlier?
If it was a real correctly-measured data point, then it isn't. Removing real data is dishonest.
If it's a measurement error, then yes. You want to come to conclusions from meaningful data.
Honest Cleaning
There is real judgement to make when cleaning data, and you have to understand the data to make the choice correctly.
Honest Statistics
Statistics are a minefield of places where incorrect conclusions can be drawn.
The details of many statistical tests are subtle: what's the difference between a Mann-Whitney test and a Fisher's Exact test? Why would you choose one over the other?
Honest Statistics
When doing inferential stats, you look at a \(p\) value, which is (approximately) the probability of coming to an incorrect conclusion by chance.
Typically, you look for \(p<0.05\), so 95% chance of a conclusion being correct.
Honest Statistics
Doing many tests increases the chances of false conclusions.
If you do 10 different tests, the chances of having everything correct is
\[ 0.95^{10} = 0.6\,. \]Honest Statistics
But is very tempting for a researcher to explore the data with many tests and do this by accident.
- Does gender affect results? No: don't publish.
- Does nationality affect results? No: don't publish.
- Does height affect results? Yes: publish!
Honest Statistics
Doing that is called p-hacking and doing it increases the chance of error in results.
Machine Learning
Machine learning techniques are very common tools for data analysis, and they can be easily abused.
ML techniques are increasingly important: they are the way that many problems are being attacked.
Machine Learning
The basic premise of a [supervised] machine learning problem:
- Given some inputs, we want to predict the (most likely) correct output.
- We have many examples of correct input + output: training data.
- A model is trained with the known data, and then used to predict on new inputs.
Machine Learning
When solving a problem, a trained machine learning model is often treated as a black box: inputs go in and predictions come out, but you don't really understand what happened in between.
How confident can you be in your predictions?
ML Accuracy
Usually, people look first at accuracy rate: what fraction of (non-training) data does the model get right?
Depending on the problem, 99% accuracy might be considered really good or really bad.
Too many people see a good accuracy rate and declare victory.
ML Accuracy
Accuracy rate treats all errors the same, but that's not always fair.
| Predict A | Predict B | |
|---|---|---|
| Class A | 39913 | 45 |
| Class B | 86 | 4238 |
Accuracy rate: 99.7%. Is that good?
ML Accuracy
It really depends a lot on what you're trying to predict, and the consequences of being wrong.
| Predict No | Predict Yes | |
|---|---|---|
| No cancer | 39913 | 45 |
| Has cancer | 86 | 4238 |
That 86 starts to look like a really big number.
ML Accuracy
A machine learning model can only be as good as the data it was trained with.
If your training data isn't a good representation of the population, then the model will be limited.
ML Accuracy
e.g. train with dogs sitting facing left; try to recognize running right.


 …
…

* * * *
ML Accuracy
This can go wrong when there's bias you don't want in the training data.
The ML techniques aren't really at fault: it's finding real patterns, just ones you don't like. That doesn't mean the results are okay.
ML Accuracy
Sometimes bias can be explicitly removed by adjusting the features that are put into the model.
e.g. If you don't want to bias by gender
, then don't include that field in the inputs when training/predicting.
ML Accuracy
Sometimes it's harder to remove.
e.g. previous work experience on a resumé might be correlated with race or gender, but you need that text to make a good prediction.
Communicating Honestly
When explaining your results, make sure you are clear and honest about what you found.
Resist the urge to make your results sound cooler than they actually are. If the results aren't very definitive, then say so.
Communicating Honestly
Also don't be afraid of limitations of your analysis.
If there isn't enough data, or the right data, or a technique to find the answer you're seeking, then you should be able to explain that clearly.
Communicating Honestly
Being honest might include technical details: assumptions about data, \(p\)-values, possible artifacts of the method.
You should probably address those (depending on the context). Do your best to explain them in a way your audience can understand.
Conclusion
Like most things, data science tools can either be good or bad. They can be used in ethical ways or unethical ways.
Understand the choices you're making and make them well.