You can also watch the video tutorial on the developer tools. It covers the same ideas as the instructions here.
You will find developer tools like these in both Firefox and Chrome. The video linked above uses Firefox and the screenshots here are from Chrome, but the tools are nearly identical (at this stage at least). Realistically, you can use either instructions with either browser.
To turn on the developer tools, you can press ctrl-shift-I, or ⌘-shift-I, or F12. The tools can also be found in the menu of either browser (but F12 is probably fastest and easiest to remember). When the panel appears, select the “Elements” (Chrome) or “Inspector” (Firefox) tab and you'll see something like this:
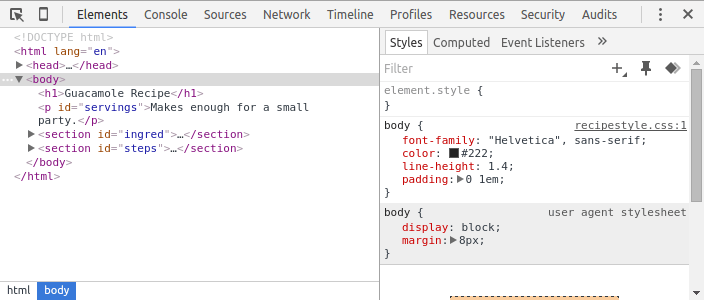
The left panel is a view of the page's HTML: you can expand and explore the elements of the page here.
If you select an element in the bottom-left, it will be highlighted on the page itself, and you will be able to see all of the CSS rules applied to that element and where they came from in the bottom-right:
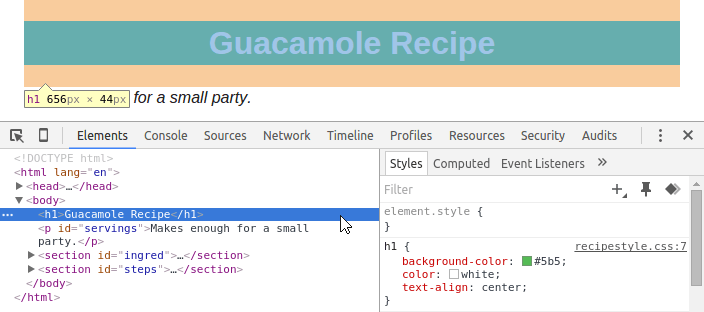
In this case, recipestyle.css on line 7 had some properties that affected the <h1>.
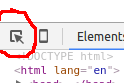
You can also select an element by clicking on the page itself: select the “pick an element” tool and then click something on the page.
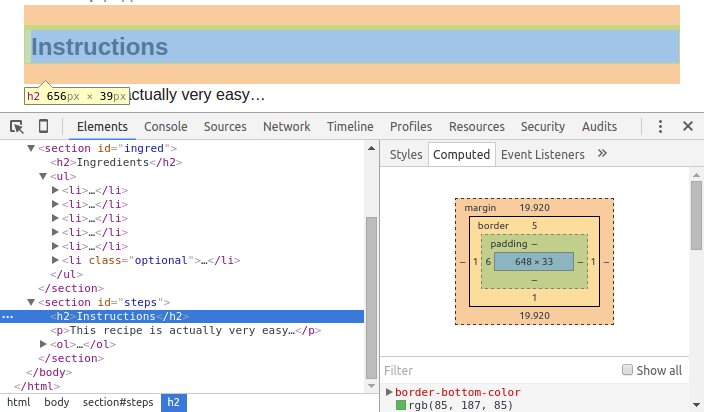
You can also select an element and see information about how the browser has laid it out on the page: how many actual pixes of margin, padding, border, width, and height it is drawn with. That is in the “Computed” (Chrome) or “Box Model” (Firefox) tab:
There are many other features in the development tools: they are extremely useful when creating web pages. These are the basic features that you will need right away when working with HTML and CSS.